TRENT ROBERTSON
Experience Designer

Menu
Experience Design
Shape complex systems into intuitive flows. Build wireframes, prototypes, and interaction models that balance accessibility, responsiveness, and simplicity.
Visual Design
Craft interfaces that feel purposeful and expressive. Use color, type, and motion to guide attention, communicate emotion, and reinforce brand trust through consistent design systems.
Motion & Animation
Infuse experiences with purposeful movement. Use motion to guide focus, create smooth transitions, and communicate system behavior—adding clarity, rhythm, and delight without distraction.
Strategy & Planning
Translate research into action. Define experience goals, align with business metrics, and collaborate with product partners to prioritize high-value opportunities.
Collaboration & Execution
Drive alignment across disciplines. Partner with engineers, researchers, and product teams to refine solutions, facilitate workshops, and ensure pixel-perfect delivery.
Testing & Iteration
Validate early and evolve quickly. Conduct usability testing and A/B experiments to refine experiences, balancing near-term feedback with long-term vision.
Leadership & Mentorship
Elevate teams through mentorship, critique, and shared standards. Advocate for design thinking and communicate strategy through clear, business-connected storytelling.

A few years ago, I found myself in a late-stage startup whose mission was to save lives and property by better managing gas utility lines. Urbint, a Salesforce-backed SaaS company, needed to modernize a 20-year-old ArcGIS-based application used by gas utility companies nationwide for high-risk pipeline replacement planning. The outdated platform caused planning inefficiencies, delayed emergency response, and increased exposure to risk. My strategy was to offer the user a highly intuitive and visual way to completing the task at hand. I used existing patterns to increase productivity while lowering error rates.

"Creating RAPs from scratch takes up my whole day, with no time to tend to other important issues."
"I feel like it's 2004 everytime I open the [Urbint] software"
Put the user first by empowering field engineers to build Risk Assessment Plans (RAPs) for pipeline replacement that factor in age, composition, environment, and repair history via a clear, intuitive interface.

Conducted surveys and context interviews with field crews and executives to surface their top frustrations and unmet needs.
Synthesized pain points, including difficulty locating asset data and interpreting GIS layers under emergency conditions.
Brainstormed solutions around intuitive navigation, interactive tutorials, and ML-powered risk scoring.
Created wireframes, clickable ArcGIS overlays, and a rapid “RAP builder” flow to visualize the end-to-end experience.
Ran two rounds of usability sessions with real pipeline planners, iterating on micro-interactions and labeling conventions.

Research & Empathy
Facilitated three multi-stakeholder workshops (C-level through field engineers) to align business goals with user realities.
Mapped the end-to-end service journey using journey maps and service blueprints to expose process gaps and hand-off friction.

Delivered a suite of artifacts—journey maps, stakeholder maps, affinity diagrams, UI patterns, flowcharts, wireframes, and a clickable prototype—anchored in ESRI ArcGIS data.
Enhanced the design system with new visual tokens, interactive map components, and ML-driven risk score badges.

Transformed a spreadsheet-driven workflow into an interactive, map-based RAP builder.
Surfaced only the three most critical data points at each step, reducing cognitive load and speeding decision-making.


Presented the UX strategy to Urbint executives via a visual-first deck—using before/after mockups, annotated heatmaps, and video clips of the prototype in action—to secure buy-in and drive roadmap prioritization.
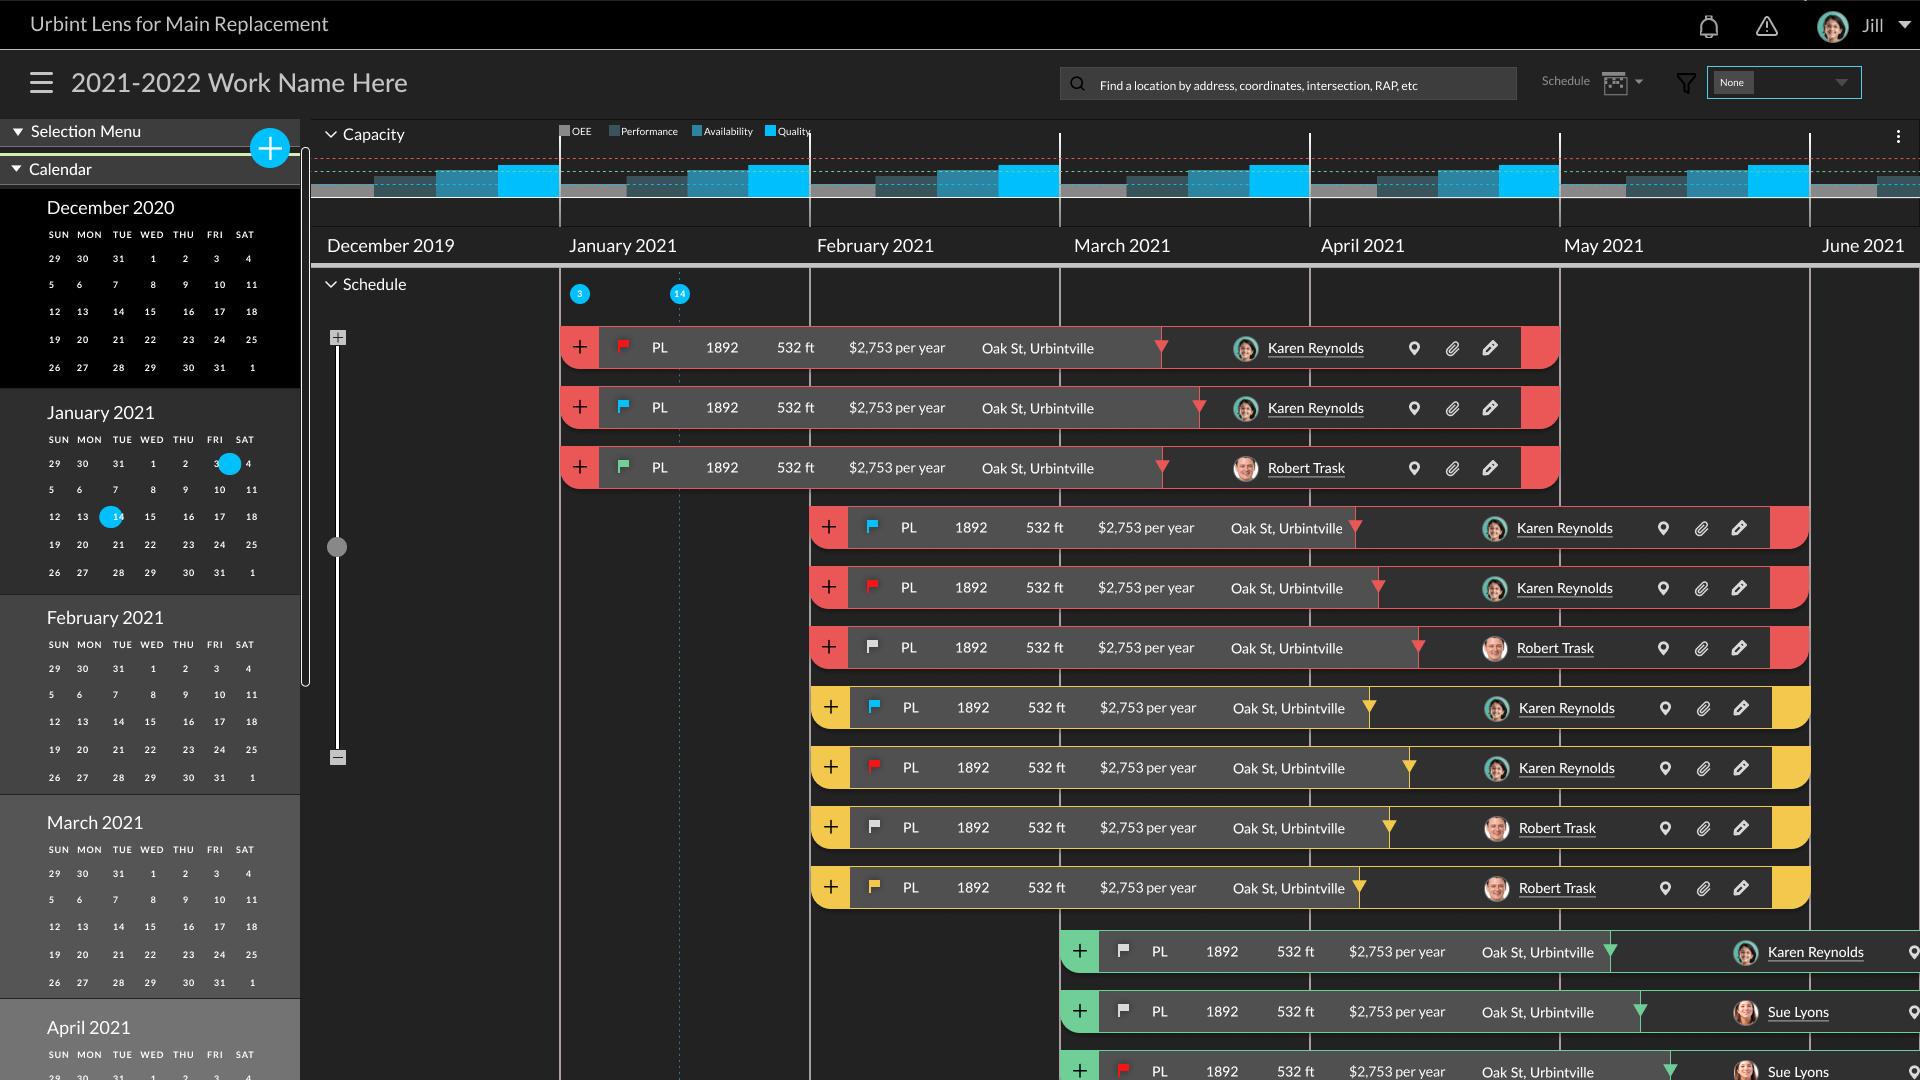
In the workflow example seen below, the analyst is creating the RAP (Risk Assessment Plan) by clicking on the map to select main lines (larger pipelines that feed gas to each customer via service lines) to be added to the RAP. Pipes are color coded according to criteria such as pipe age and material, environmental conditions, historical incidents or repairs, and the proximity to critical infrastructure or populated areas.
.webp)
40% reduction in RAP (Replacement Assessment Plan) planning time
Improved user confidence and trust in real-time visual data tools
Simplified complex workflows with intuitive UI and mapping features
Recommendations adopted firmwide and integrated into Urbint’s roadmap
Designed mobile-ready solutions for future scale and field usage
By applying service design thinking to ArcGIS-based risk management, I helped transform an outdated tool into a mission-critical platform that saves time, improves safety, and scales with the growing needs of utility companies.